Do you think teaching math causes you to over think??? Almost like “going insane “…NaNa Dunn from a post on Visual Math’s FB page

Oh yeah! I used to dream about my lessons… over and over during the night. I’d wake exhausted. Here’s an example of what I do now…

When you realize the students can’t ‘see’ the thing you are teaching them

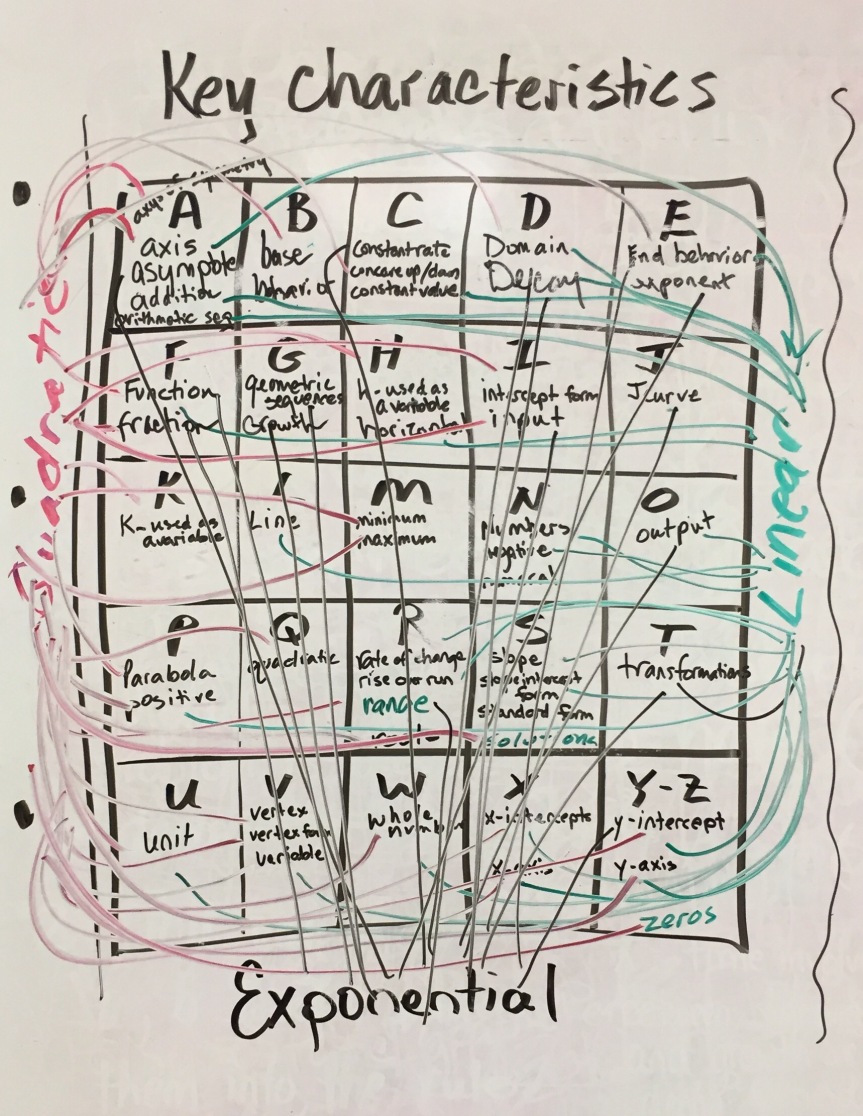
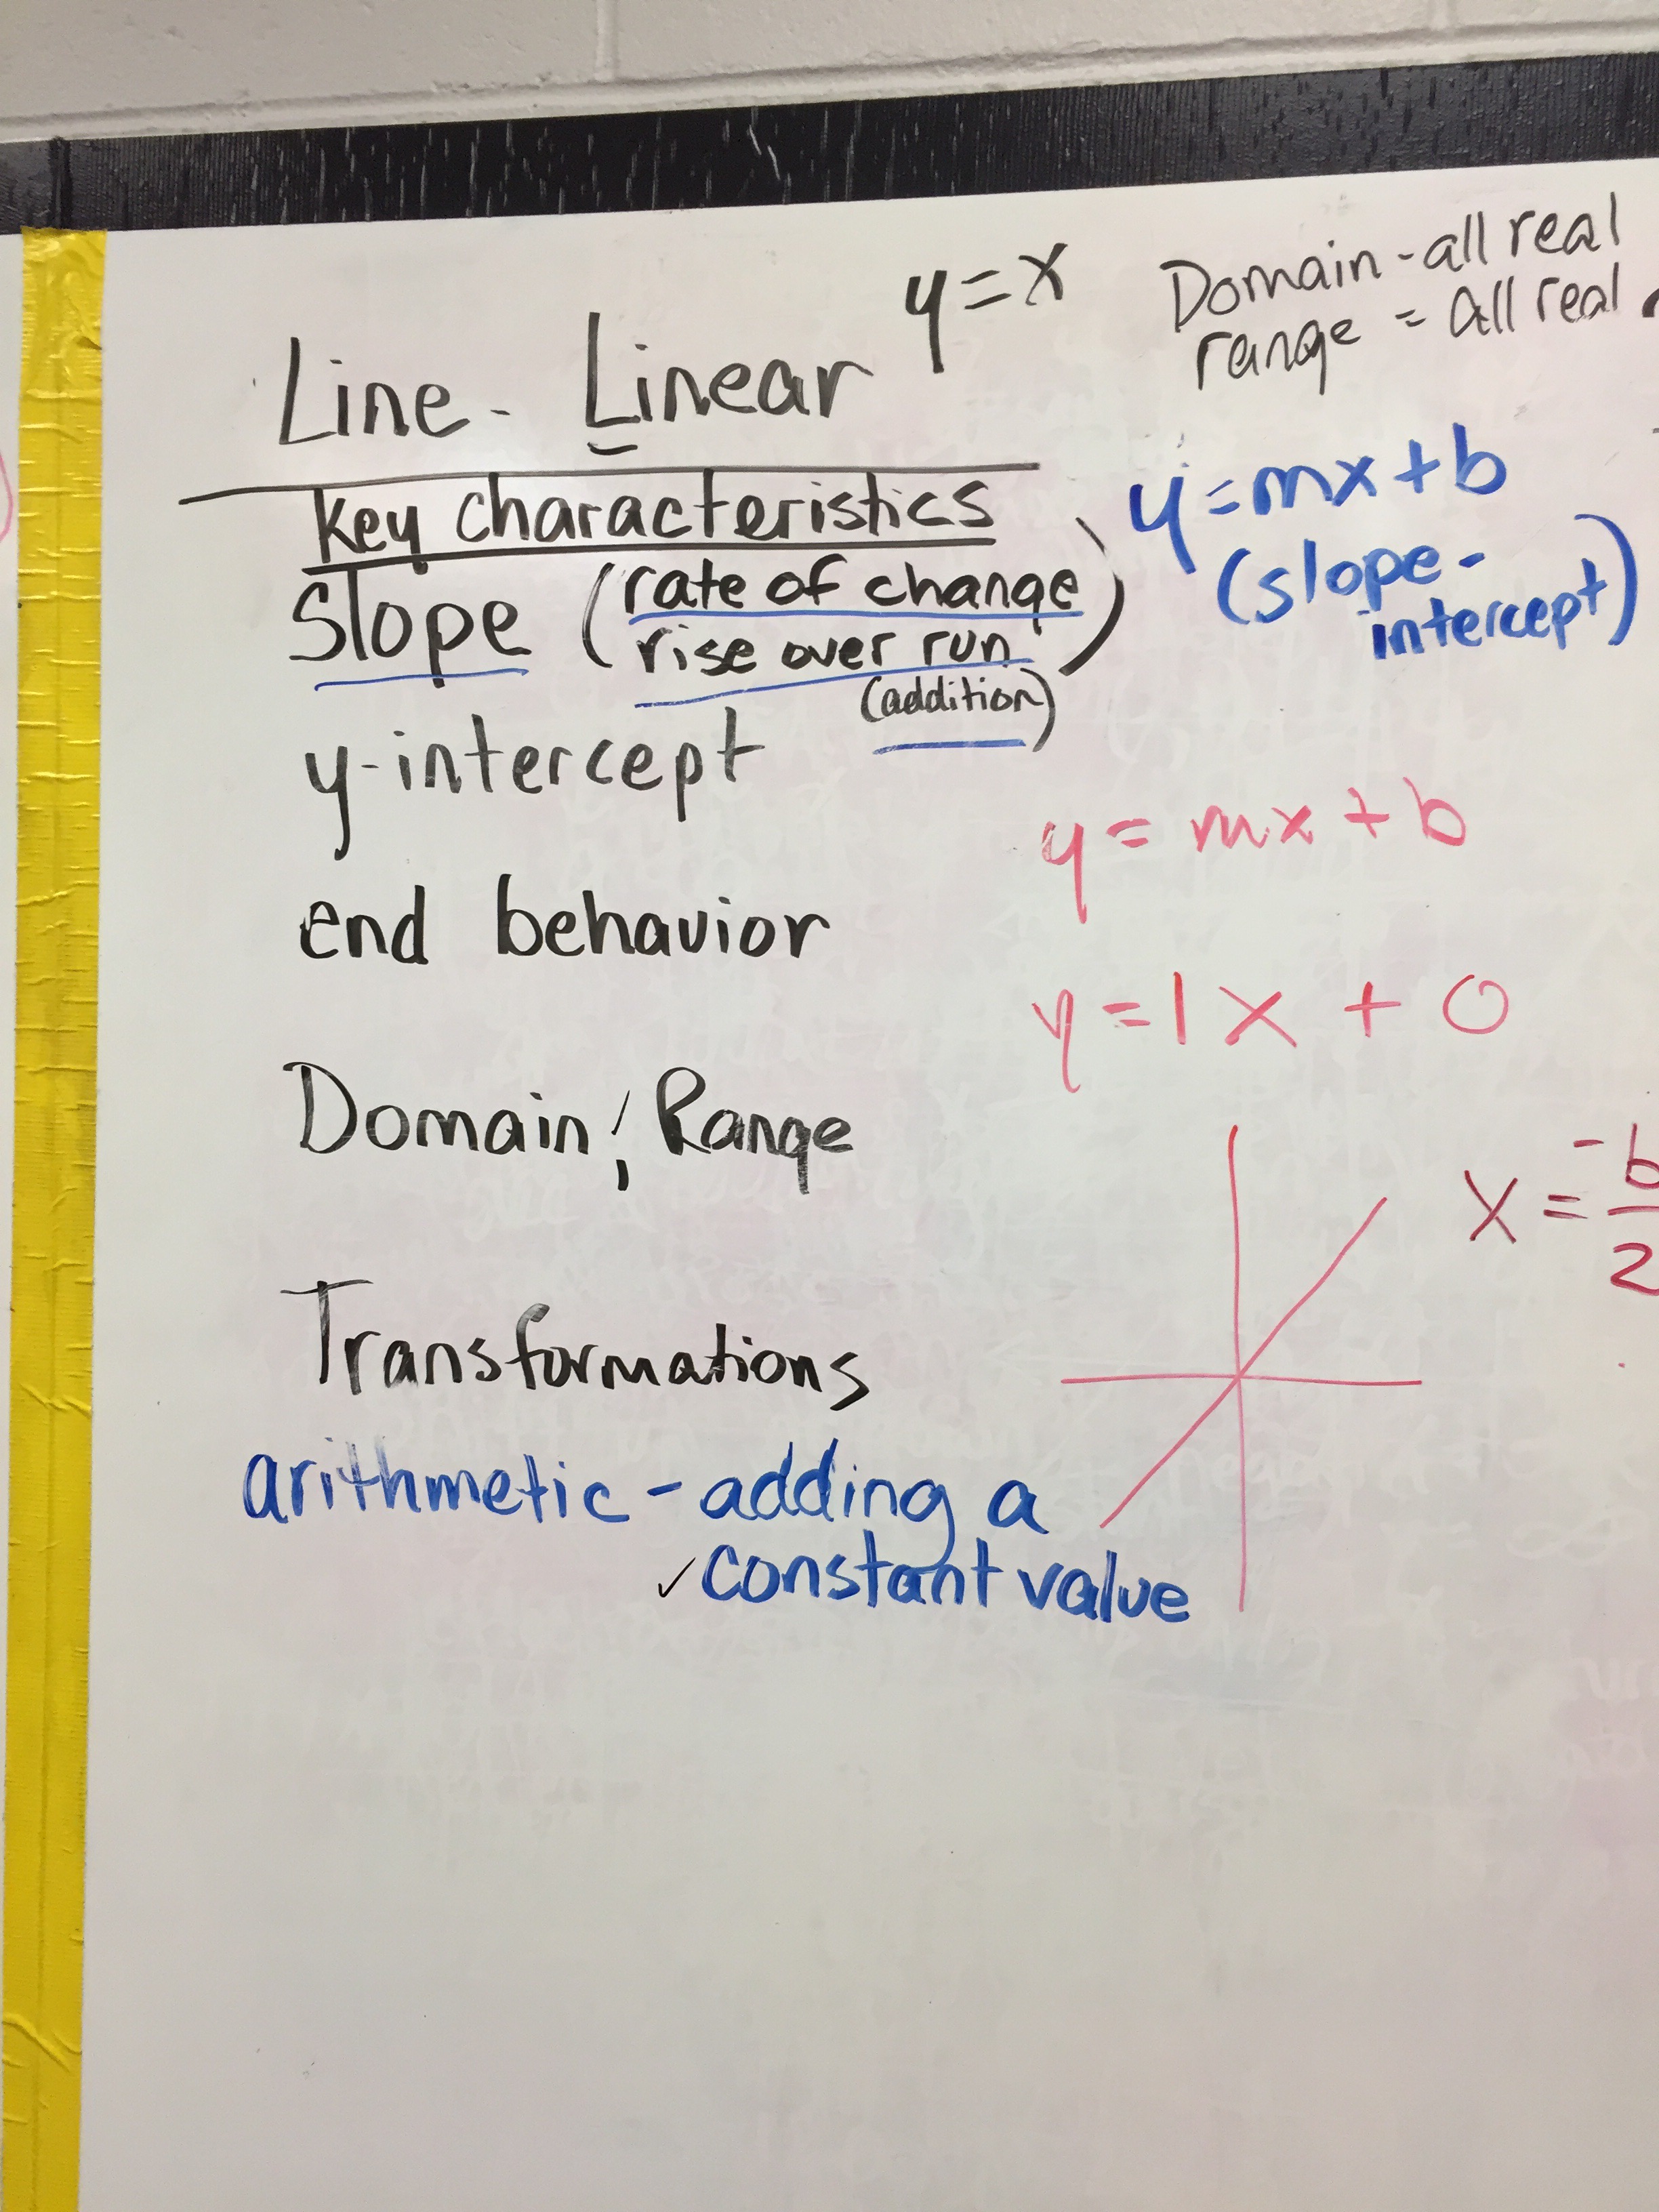
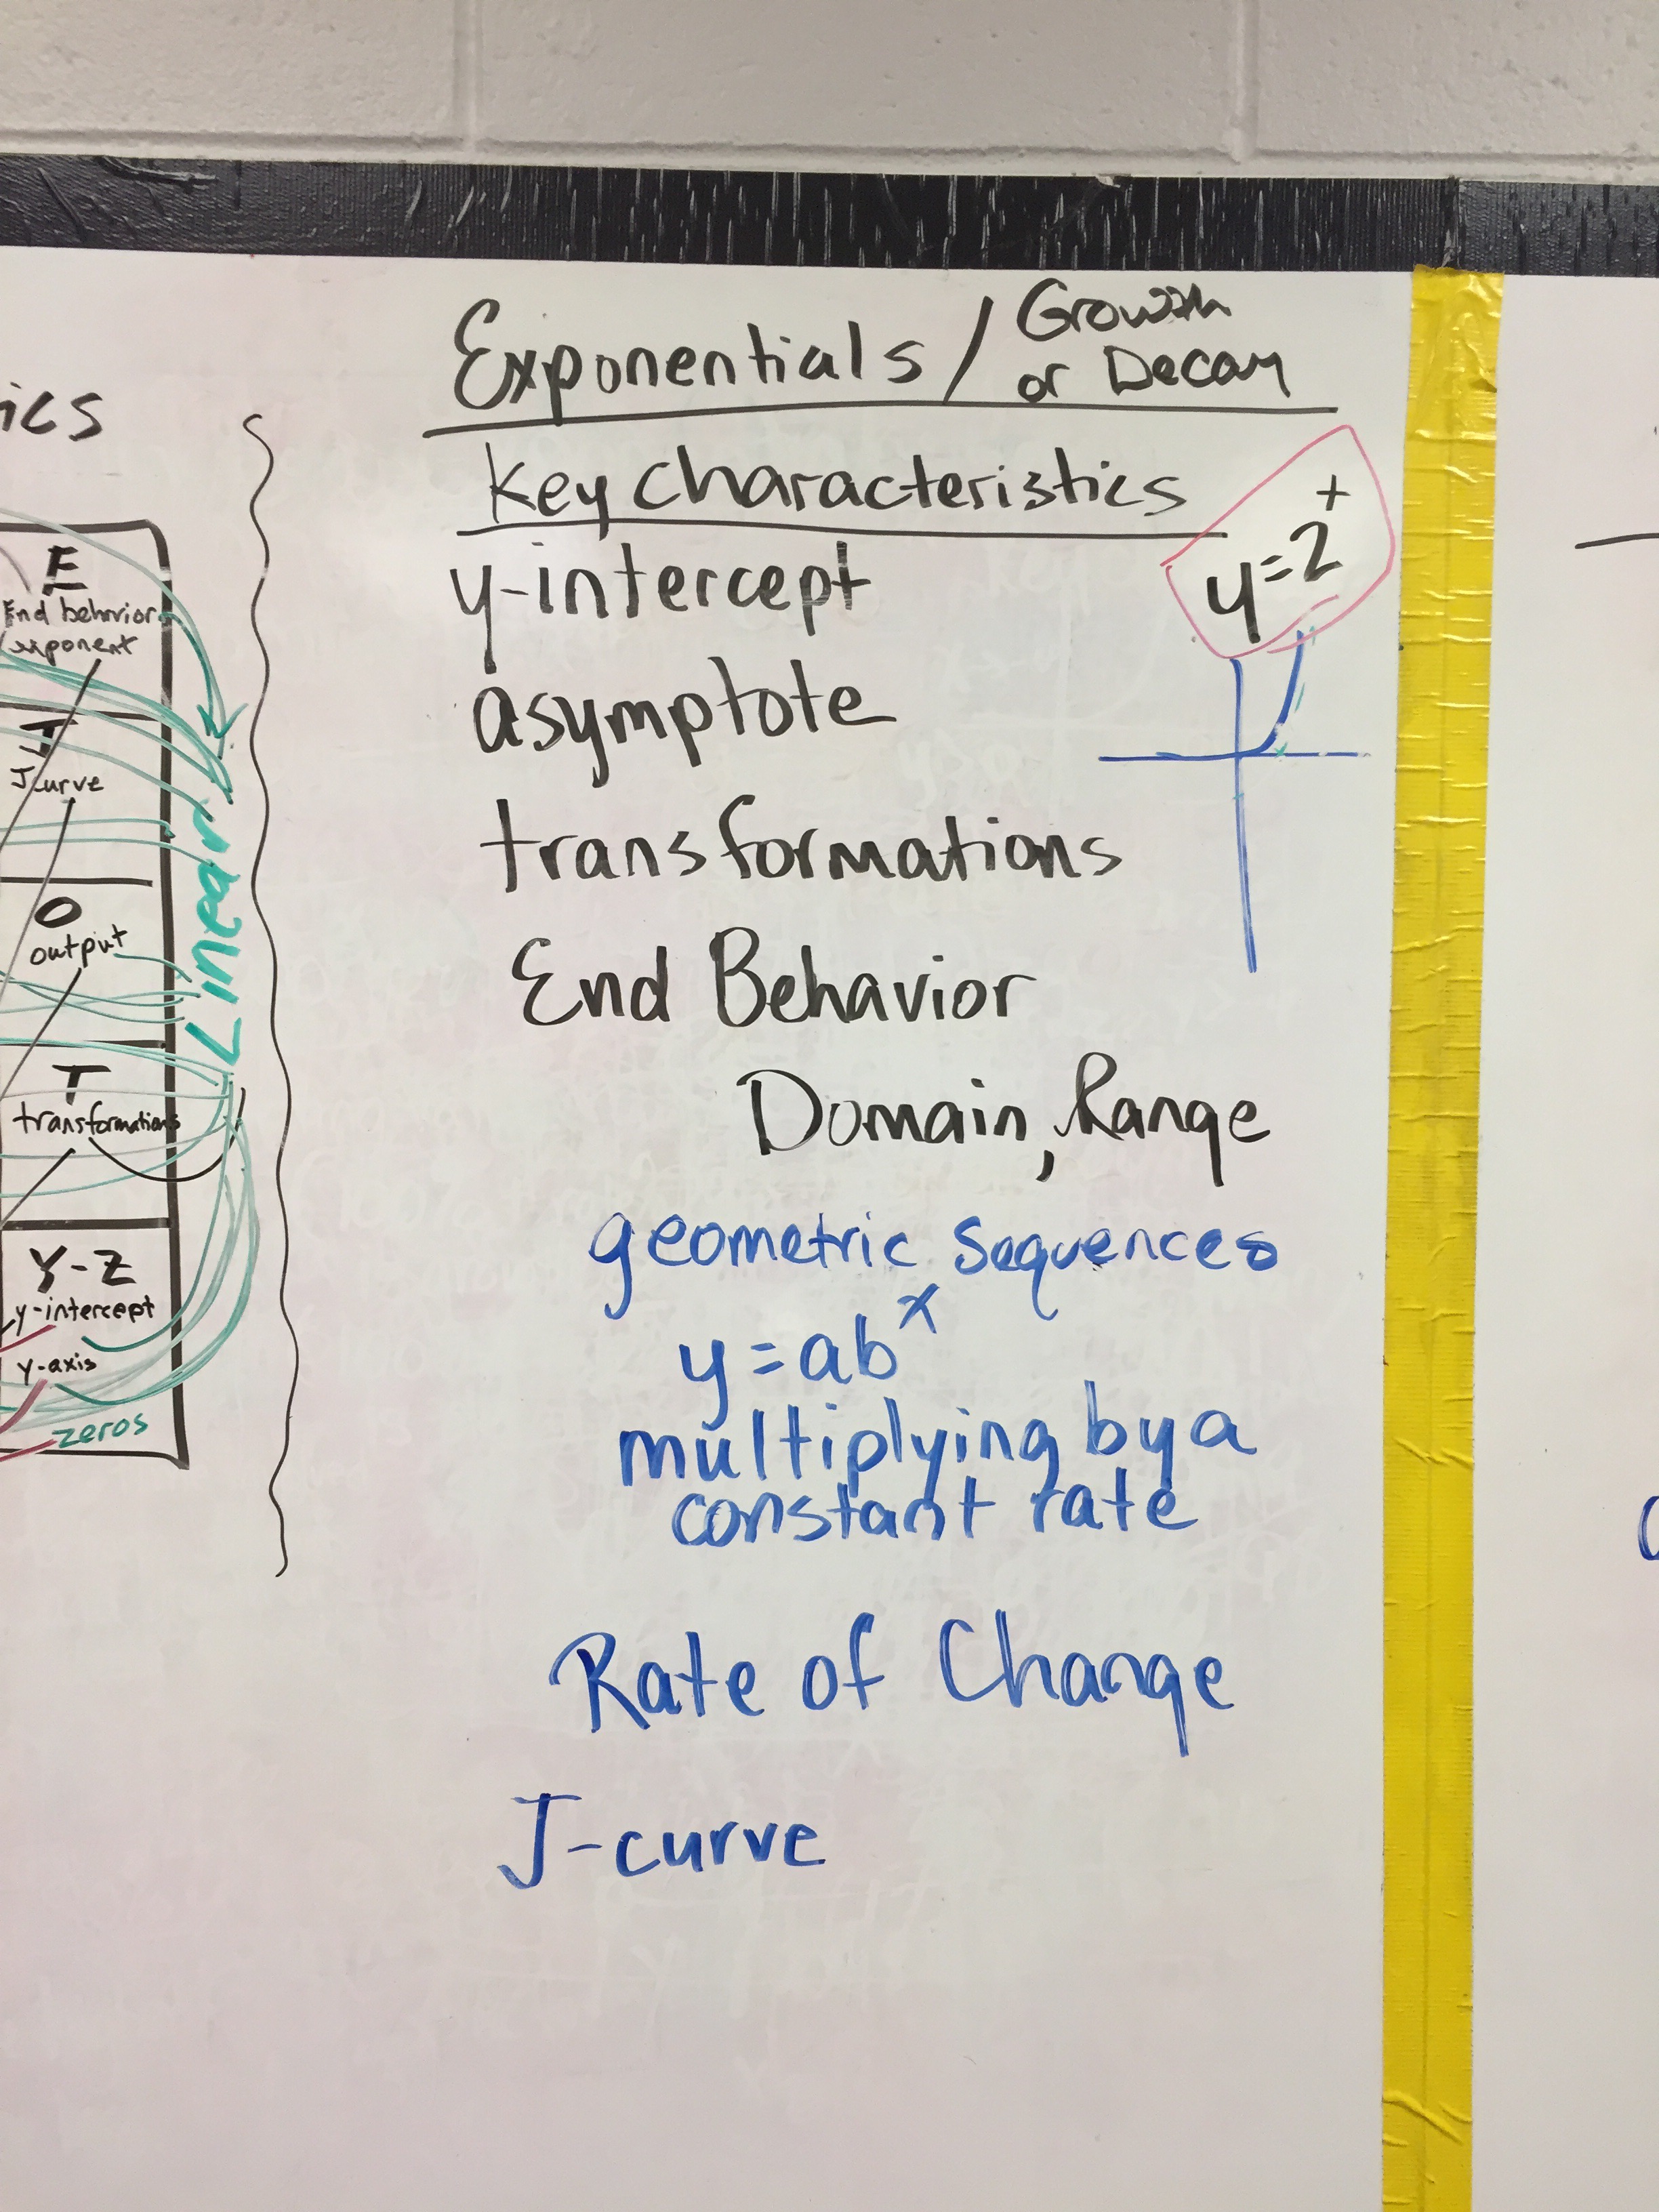
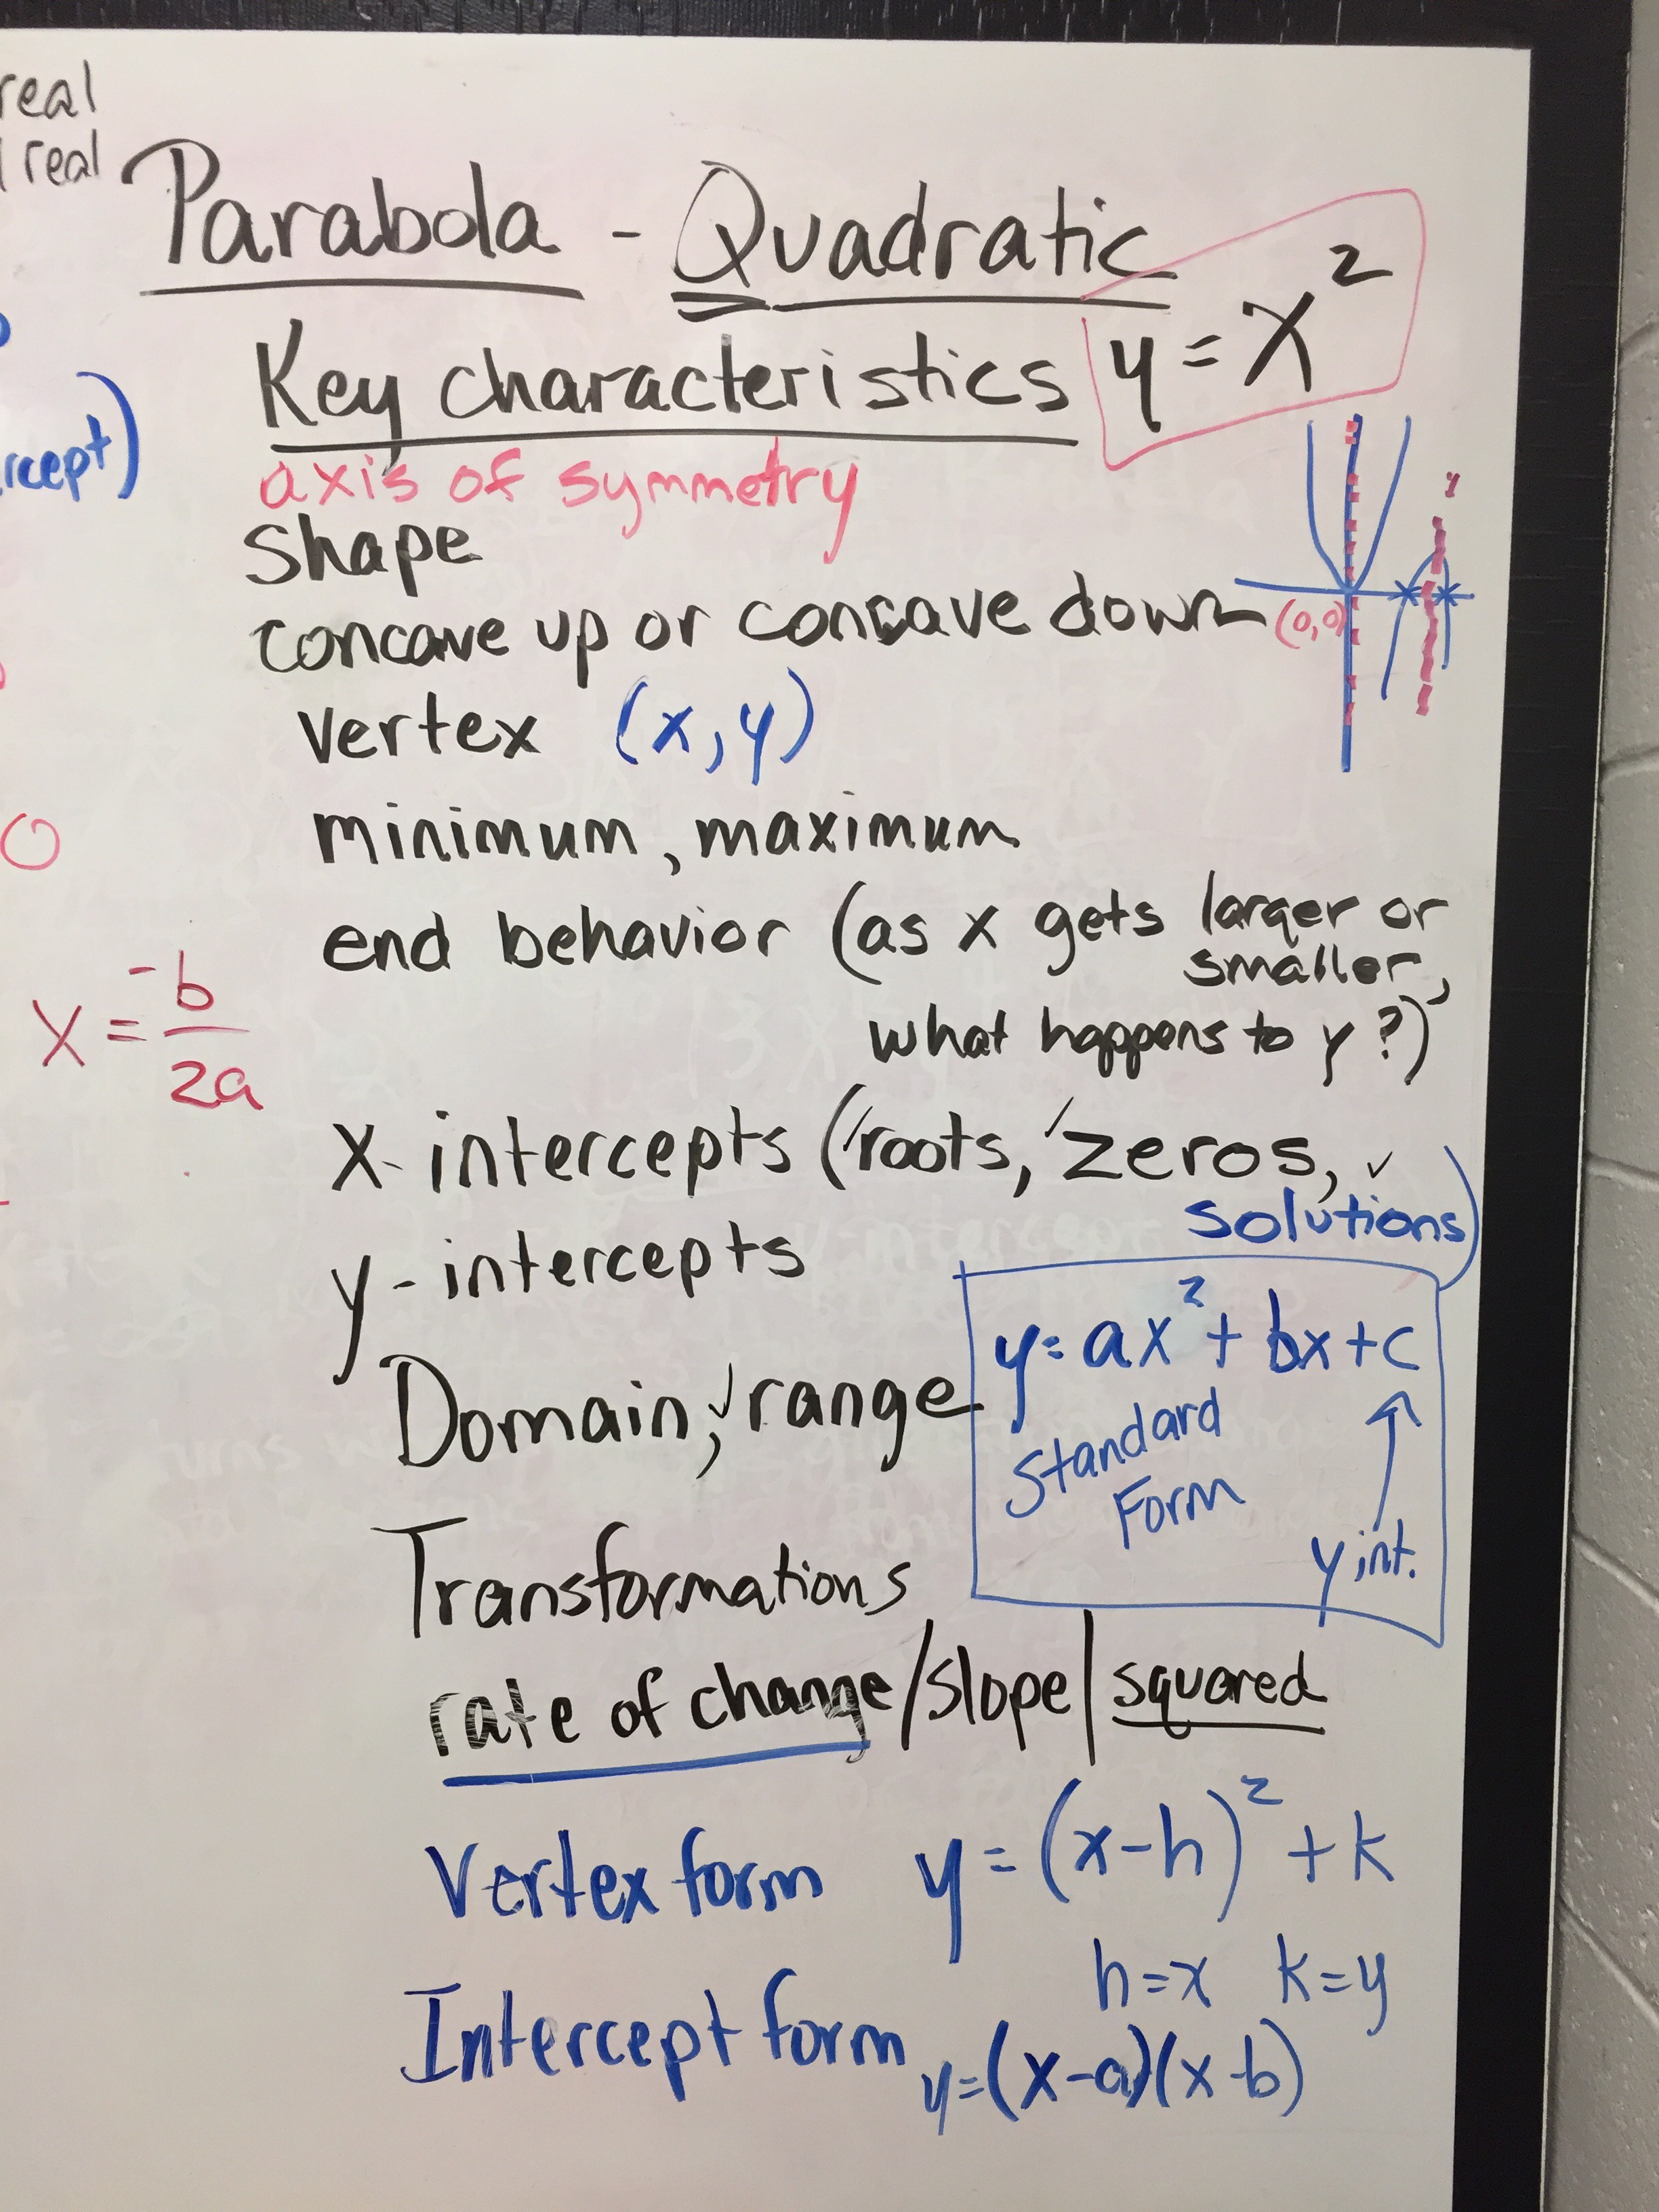
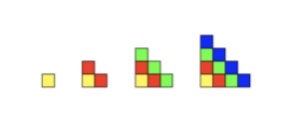
My kiddos are learning to write quadratic equations. This requires them seeing patterns of growth. The first lesson in this series was to help them see the growth in a pattern of cubes. I used a YouCubed lesson that involved coloring each growth step. Just that. This exposed several issues. The lesson with numbers was the next day, and I was pleased by the intensity of their interest, but here’s why I think that happened: I had prepared them for what they were looking for.

Color each growth step. Image from Stairs to Squares Gr3-5, YouCubed.org

Quotes taken from the original FB post…

Beth Hanna McManus writes “My 8th graders… totally missed the concept that the altitude to the base of the triangle goes through the vertex and hits the base at a 90 degree angle. I explained this in mathematical terms, in layman’s terms, using words like straight to the base, “shortest distance”, had them draw them on the white boards (checking and helping each drawing) multiple times, had them label triangles. When it came time for homework, no one knew what to do. I flipped out and spent the rest of the day in a dither wondering what is wrong with me that I can’t communicate with these kids…”

When I plan a learning experience, I look for the base skill/image/idea a child needs to be able to have to participate in a lesson. It may be a simple warmup – for the triangle problem above, after realizing they didn’t get it, I might have them draw the altitude, pointing out the way the angle looks, and how it starts in the vertex, in several different triangles. Just that. No math, just letting them learn to see what they are looking for.

Starla Adams writes, “Yes, yes, and yes….says the teacher who is out of strategies to teach long division after Friday. I actually thought I was going a little bit insane for an entire hour.”

Teaching long division is challenging. I’ve worked with 9th graders who do not understand what dividing does. If they don’t have an understanding of partitioning and regrouping, long division is just a nonsensical set of steps that they must follow – and memorize. A warmup using manipulatives (coins buttons beads) to set the stage for dividing into groups would help them understand what they are looking for. Then long division can be taught as a routine to get there.

Another common student skill gap with division is poor factoring skills. A warmup (or preview lesson the day before) with a factoring math problem string like this video from Pam Harris, might help strengthen their math fact fluency.

While working on any new skill that requires factoring, try giving students a factor chart. They won’t be using all their working memory on remembering number facts, but on learning the process of the task at hand.

Learning plans should empower students…

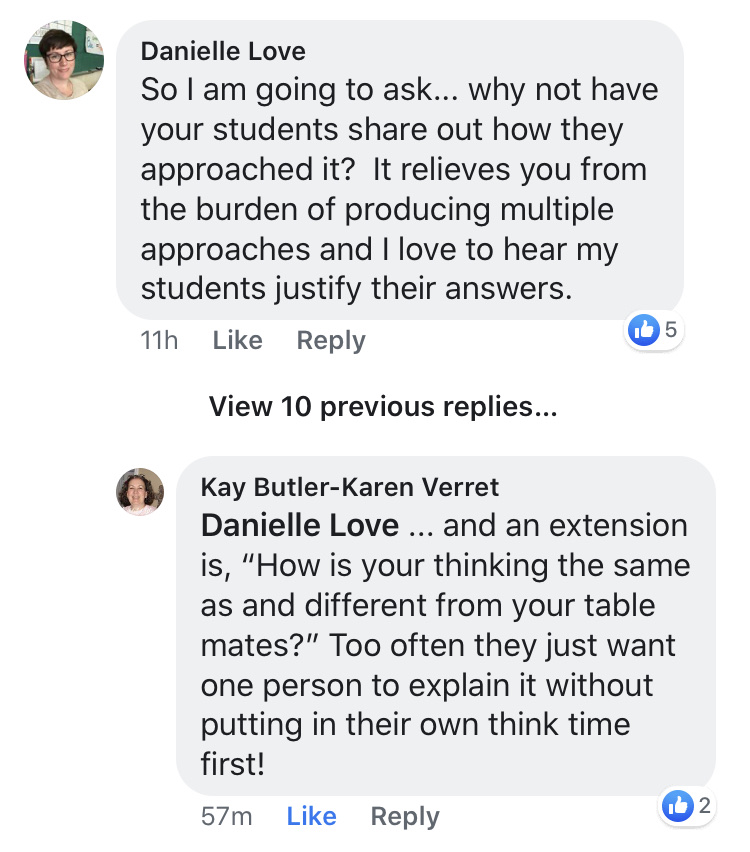
I realized that my 9th graders didn’t yet know that they had the power to create their own understanding. They were waiting for me to tell them what to do. Danielle Love and Kay Butler point out ways to shift the heavy lifting (and learning!) to the students!

As teachers, we spend lots of time creating learning plans. Many of us already know what misconceptions kids have, and what errors are going to get made. So lets plan ahead to expose -and remediate and preview- so that these issues don’t cause student failure during the learning of new material. These little discovery sessions and warmups are critical to building understanding and are often worth every minute of time we spend on them!

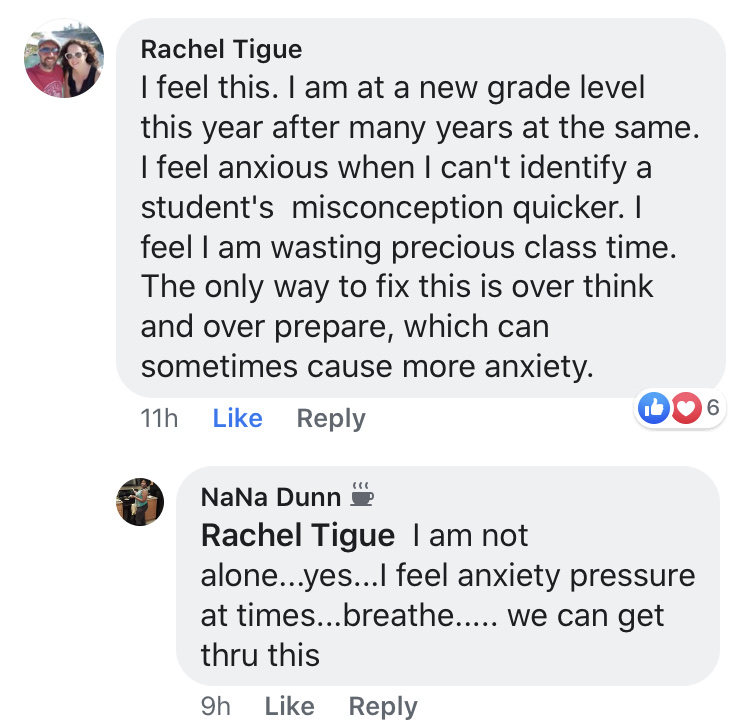
By all means, overthink and go crazy, in a most productive way! Math teachers, you rock!! I would love to hear how other teachers prepare for these misconceptions and gaps!

(And no, I don’t have those recurring math dreams nearly as often anymore!😂)

Thanks to Shana McKay of Scaffolded Math and Science, and and this really interesting thread on her fantastic FB Visual Math!

L-Q-E vocabulary (or how to drive your OCD students crazy!)

Algebra I, Unit 5, Compare and Contrast Linear, Quadratic, and Exponential functions…

This simple vocabulary lesson generated a surprising result: my kids thought the end result was too messy, so many of them didn’t want to follow the final step!

The activity uses a simple alphabet mind map. It is a 5×5 grid with a letter of the alphabet in each square. The last square contains X and Y. You can print a copy here, or have the students draw their own.

Here is a simple alphabet mind map.

The standards for this unit were that students should be able to identify linear, exponential, and quadratic functions from equations, graphs, tables, and contextual situations, and be able to compare each function with regard to rates of growth.

To achieve these skills, students needed to be able to identify the key characteristics and key vocabulary associated with each type of function. They also needed to be able to discern small differences in equations, the shape each functions takes when graphed, and the changes in a table that would indicate what type of graph the table would produce. Given contextual scenarios, they needed to identify which type of situation would produce a linear change, a parabolic track, or a classic J-curve from exponential growth or decay.

When we started, they could barely list the key characteristics, much less identify which function was associated with each characteristic, what those characteristics looked like, or how to tell them apart. They needed stronger, more fluent use of the vocabulary!

Step One, The challenge: using each letter of the alphabet, fill in the grid with the names of as many key characteristics of each type of graph as each student could think of. (We’d made lists over the previous several days, along with examples, so I knew they would be able to come up with several familiar words.) I encouraged them to start with any word they could think of that they associated with graphs or equations. As they wrote, I then passed out colored pencils for the second part of the task.

Step Two: After about 10 minutes of individual work, we came together in a large group, and I asked each student to share one item from his/her list. I encouraged the students to add new words they heard to their papers, and to use a different color  pencil than they used to write their initial lists. After going around the room about two times, we asked kids to popcorn choices that they had on their papers that hadn’t been covered. We had a few letters that remained without words, so we again asked for ideas from the whole group that would fit for those letters, reminding the students to stay within the linear, quadratic, exponential, and graphing parameters.

We found that we had to ask a few thought provoking questions to make sure some important terms weren’t left out.

(At this point, because we were talking about why these words were acceptable, what they meant, and how they were related to LQE, I had a pretty strong idea of where my kids needed additional help and lessons!)

As my students shared their words, I wrote them on a poster sized alphabet chart that I had prepared beforehand. I gave the students a few moments to make sure that they copied all the words from the collaborative chart onto their personal charts.

Step Three: each child labeled the outside of their chart with the words LINEAR, QUADRATIC, and EXPONENTIAL.

I explained that we were now going to match each term with the function to which it belonged by drawing a line from the word to the function. I warned them that some words might belong to more than one function!

They each picked a color to use for the line that would connect the appropriate words to LINEAR.  The first word under A, asymptote, was determined to be related to exponential, not linear. Not only did they have to decide which function, they had to say WHY and in what way the word connected with FUNCTION. The word Axis was next. Everyone could get behind that as a graph term that could belong to any of the function types, but we only connected words to one type of function at a time. We would come back to ‘axis’ two more times as we matched words with the other two functions! Colored lines were drawn from Axis to LINEAR. This happened with several more words, before the students began to realize this was going to get messy. I was drawing the same lines on my big poster, but I was totally surprised as students began color coding each word with dots, or making these neat lists on separate pieces of paper, sorting out each of the characteristics, because they didn’t like the tangled mess that was happening on my poster. (I explained that they were actually drawing the map for their brain, not their eyes. They were somewhat skeptical…). ‘I can’t read it,’ was the standard response!

Here was our resulting map!


I  encouraged the students to use a different color for each category, and we progressed in order through each function, so no one would end up confused. Throughout the matching, as students popcorned answers regarding which words to connect,  I continued to ask for agreement, disagreement, (thumbs up, thumbs down) and ‘why, how do you know,’ from the whole group. This was a very intense, fast paced portion of the activity, with even some of my most blasé students getting involved!

We followed this activity with a neat card sort, that was another intensive activity in and of itself, and was spread over two days. By the end of these activities, I could tell that more of my students were fine-tuning their selection processes, looking more closely at the details of each equation, graph, or table, and applying the key characteristics lists they’d made to their compare and contrast process!

Here were some lists they made of the key characteristics:

Best 1st Day of School?? 

Dateline: Monday, August 10, 2015 Gwinnett County, GA

Today is the day! The streets are filled with yellow buses; sidewalks have filled with backpack-covered children, as if a clutch of turtles are migrating. Cars fill Continue reading “Best 1st Day of School?? “